
Getting there: In the left sidebar of Opendate, click the tickets icon. Then, you will see each event listed. Hover over any event and select Marketing Insights.
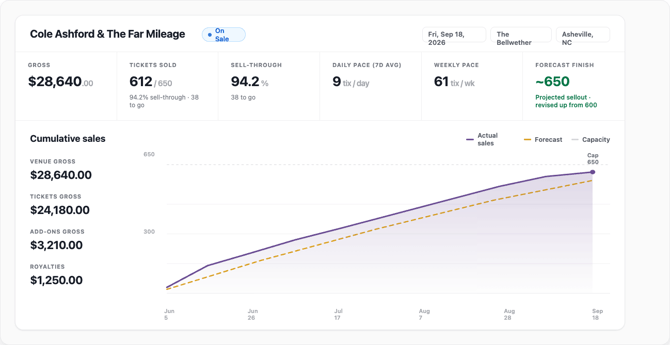
KPIs and sales chart: the top of the page shows key numbers and a cumulative sales chart. The dotted line is the forecast, the shaded band is comparable shows, and the expected finish projects where the show lands at this pace.
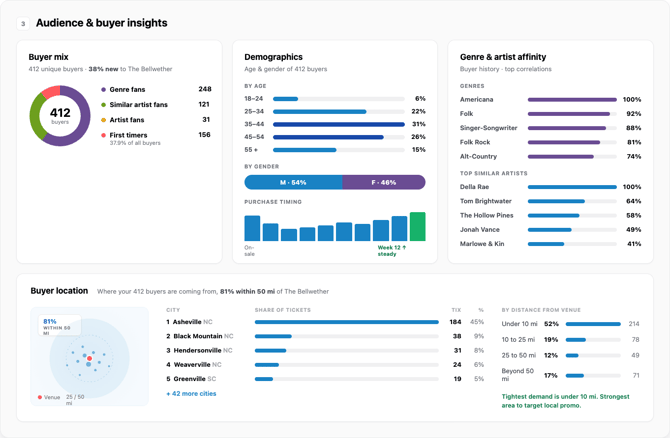
Audience: age, gender, and purchase timing for buyers on this show, plus genre and artist affinity drawn from their history.
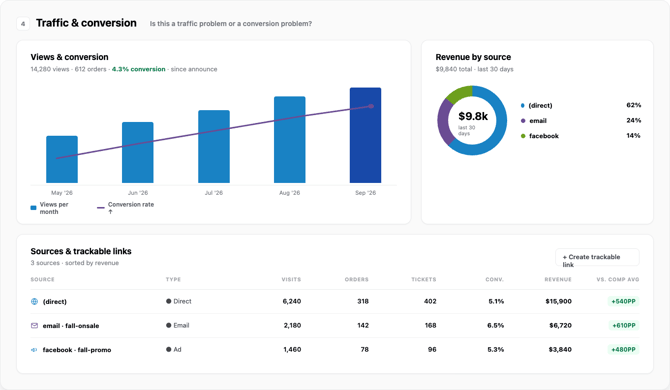
Traffic and sources: views and unique sessions for the event, the conversion funnel from views to orders, and a sources table with trackable links. Meta Ads entries link to ad-level detail.
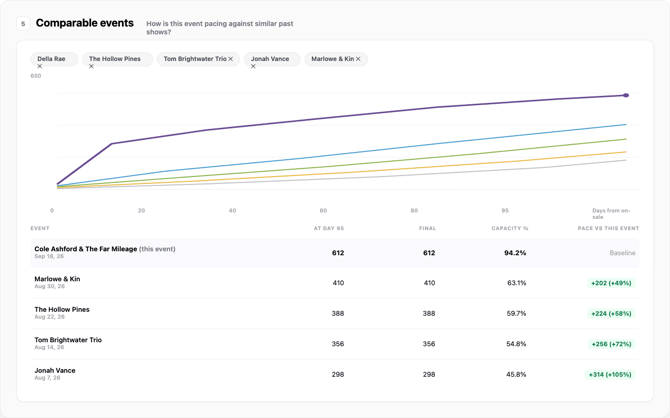
Comparable events: the comparison table shows how this show stacks up against similar past shows at your venue.
Segments and actions: segments are built automatically for this show's likely buyers. Use the actions panel to start a campaign from what you see.
FAQ:
- Where did the old dashboard go? Marketing Insights replaces it. Orders, refunds, and payouts are still available below the page.
- How is the forecast built? From comparable shows: same venue, similar genre and artists.
- Why do views look different than before? Views now count widget loads, so embedded ticket widgets on your website are included.